Remotely debugging PHP on Azure Web Apps with ngrok
One of the most pain points during PHP development is usually debugging for me. Quite frankly, I hate to run and debug PHP applications on my local machine, because when you move them somewhere else (to another environment) they sometimes don't work and you have to do some more configuration (let's ignore the fact that Docker or similar solutions can solve this on a decent level).
What I really like to do is to write and debug applications directly on Azure App Service, which makes this problem go away. The only issue that comes up with this is debugging.
Originally, when I started in PHP (back in 2008), I had no clue what debugging was, didn't know what breakpoints mean and so on. So I sticked to using functions like echo or print_r. It can do the job if you have a clue where the issue might be, but when you are clueless it can take hours to "debug" the code correctly.
Long story short, after some time, I discovered Xdebug which allowed me to debug PHP in a quite decent manner. In combination with Visual Studio Code and PHP Debug extension this became super easy (I will probably make a separate post on the combination of PHP and VS Code).
So moving on with these great tools, I started wondering about the ways to remotely debug my code with this setup right on Azure Web Apps. The easiest way for remote debugging with Xdebug is to have a public IP (or have the server in local network) so it can connect back to you directly, which may be an issue, if you are behind NAT.
Since most of the time, I don't have access to a public IP address and don't want to expose my ports, in the Linux world, there is an option for forwarding SSH ports to your machine (can be easily done through PuTTY). While this sounds like a great thing, the issue is that you need to have SSH capable server which can communicate with the website and your computer, which can be a pain point in Azure (and can cost few extra $). The entire process of setting that solution up is described on Microsoft's Engineering blog.
Configuring ngrok
Lately services like ngrok became very popular - it is a kind of tunnel which can expose your local port to the internet, usually temporarily, for showcase or similar situation. So I thought that it has to work with Xdebug as well, and it did!
First step is to sign up at their website in order to get the access key for their API (luckily, they offer a GitHub/Google account login, so the process is extremely fast). The next step is to install ngrok itself onto your computer. Since they don't have any installer, and they give you a simple executable instead, I chose to install it through NPM. Great thing is, that it also adds the executable into PATH so you can use it anywhere.
Just FYI, the installation command is following and requires NPM (and Node.js to be present on the machine):
npm install -g ngrok
ngrok authtoken 1234567890abcdefghijklmnopqrstuvwxyz
Xdebug actually uses TCP/IP to communicate with the debugger's front end, so you need to set up ngrok to create a TCP tunnel for you. We are going to use Xdebug's default port - 9000 on our local machine, so we will open the TCP tunnel:
ngrok tcp 9000
After executing the command, you may get a firewall prompt from Windows, so you may want to enable the application through. The final result in your Command Prompt (or PowerShell which I prefer) is going to look like this:
ngrok by @inconshreveable

Tunnel Status                 online
Version                       2.1.8
Region                        United States (us)
Web Interface                 http://127.0.0.1:4040
Forwarding                    tcp://0.tcp.ngrok.io:18396 -> localhost:9000

Connections                   ttl     opn     rt1     rt5     p50     p90
                              0       0       0.00    0.00    0.00    0.00
Here you can see the following: the host name assigned to me is 0.tcp.ngrok.io and the port 18396 (this is the port that Xdebug in Azure will connect to).
Configuring Azure Web Apps
Now we have ngrok in place, and the only two things left to configure are Azure Web Apps and Visual Studio Code. Let's start with Azure Web Apps (which is super easy).
All we have to do is to add Xdebug to the website's PHP configuration and tell it to connect to our tunnel:
xdebug.remote_enable = 1
xdebug.remote_handler = dbgp
xdebug.remote_port = 18396 ; This is the port we got from ngrok
xdebug.remote_host = 173.255.197.142 ; The IP address behind 0.tcp.ngrok.io
zend_extension = "D:\devtools\xdebug\2.2.5\Php_5.6\php_xdebug-2.2.5-5.6-vc11-nts.dll"
Here are just two things to note: first, you need to translate the hostname of ngrok's server to an IP address, you can use nslookup or my favorite DNSWatch service. The second thing to note the is zend_extension parameter. This basically tells PHP which extension to add, notice I am using location with PHP 5.6, so my App Service is set to use PHP 5.6.
If you know PHP, you probably heard about files like .user.ini which can additionally configure the environment. If you need to know how to do this, you can user the Azure's tutorial which is quite self-explanatory. After doing this, you may need to restart the website in Azure in order for the changes to take place (unless you wanna wait until PHP fetches the new configuration).
Visual Studio Code
Last but not least is the Visual Studio Code configuration. You could use this method with PHP Tools for Visual Studio from DEVSENSE or even other third-party tools like Atom or PHPStorm. I am going to showcase this on VS Code:
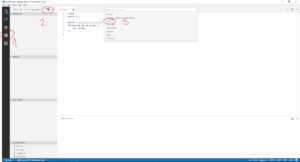
First thing you need to have installed is PHP Debug extension which I mentioned in the beggining of the article. This is going to allow you to debug PHP code from within the Code. Next step is to create launch.json configuration. The PHP Debug extension adds a default definition for PHP which we're going to start with, in order to create your own definition, look at the picture below:
From the configuration, we can only keep the Listen for XDebug configuration and we need to modify it a bit as follows: Like mentioned above, we did set up ngrok to forward all incoming TCP requests to local port 9000, so we can leave the port as it is. For the remote debugging to work correctly, we need to add following:
- localSourceRoot - The location of the folder where the project is located on our local machine, for me, it is C:/Users/hajek/Documents/Source/Temp/hajekj-xdebug/
- serverSourceRoot - The location of the source on the server, if you are using Azure Web Apps, this is going to be D:/home/site/wwwroot/ in most cases.
The final look of the launch.json file is following:
{
    "version": "0.2.0",
    "configurations": [
        {
            "name": "Listen for XDebug",
            "type": "php",
            "request": "launch",
            "port": 9000,
            "localSourceRoot": "C:/Users/hajek/Documents/Source/Temp/hajekj-xdebug/",
            "serverSourceRoot": "D:/home/site/wwwroot/"
        }
    ]
}
Note: The content of localSourceRoot and serverSourceRoot should be identical for the debugging to work correctly. I am using WinSCP as my FTPS client - it has a great function called Keep remote directory up to date which basically constantly synchronizes the changes from my local directory to the remote one. You could also use VS Code's FTP Sync plugin which does this too (but watch out, it doesn't support FTPS natively as of now, but you can add it manually see #62).
Debugging
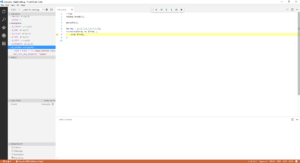
So with all of this setup, we are ready to remotely debug our PHP code on Azure Web Apps! The last thing to do is to insert a breakpoint into your code. With remote debugging, inserting a breakpoint using Visual Studio Code doesn't seem to work correctly, so we have to insert a breakpoint function into our code - xdebug_breakpoint();.
The sample code I have been using is following:
<?php
xdebug_break();

phpinfo();

$array = [1,2,3,4,5,6,7,8,9];
foreach($array as $item) {
    echo $item;
}
Now you need to start the debugger, either by pressing F5 or clicking the green run icon in the Debug section of VS Code. After this, all you need to do is to open the website's URL and append XDEBUG_SESSION_START=name behind it, because as we have it configured currently, XDebug is going to start only if this parameter is present.
If you wanted it to run with all requests (for example with your own deployment slot for dev), you can change the PHP and add the following line:
xdebug.remote_autostart = 1
Final thoughts
I believe this is a very useful and great way which can boost your productivity as a developer while writing PHP code on Azure App Service.
Also on a last note, you could use this technique to also remotely debug a Linux server in case you can't or don't want to use SSH tunnel.


Comments
alvsoft
Excellent!!! Good job!!! Thanks a lot
Remotely debugging PHP on App Service on Linux – Honza's Blarg
[…] previously wrote about the possibility of remote debugging PHP apps in Microsoft Azure using ngrok. This solution wasn’t much secure and required the use of 3rd party software. During build, […]
To submit comments, go to GitHub Discussions.